Under the Helmet: Quantifying Pressure in IPL Batting
Introduction
Pressure.
We’ve all felt it, hands a little colder, heartbeat a little quicker.
Professional athletes train for years to control that chemical chaos, yet every fan senses the moments when even the greats look mortal:
the last ball before tea with eight wickets down, 60 off 24 in a T20 chase, or simply knowing the tailenders won’t finish the job for you.
Turning such a complex, in‑the‑moment feeling into a mathematical truth sounds borderline heretical.
But that’s exactly what I am trying to do.
I’m a maths nerd that can swing the ball a bit and across these posts I’ll use hard data to peek behind cricket’s curtain—starting with a metric I call the Batting Pressure Handling Index (BPHI).
TL;DR
- We model the pressure on every ball in IPL history.
- We weight each run, boundary, and dismissal by that pressure.
- We shrink the result so one‑match wonders don’t outrank Virat.
- Jump to the leaderboards →
If you just want the leaderboards, jump to the tables below.
If you relish equations, read on.
Why Quantify Pressure?
“If you can’t measure it, you can’t improve it.”
—a line often pinned on Peter Drucker but probably coined by a bored analyst at Lord’s.
Strike‑rate, dot‑ball %, false‑shot %—coaches already track the lot.
Trouble is, none of those care whether the ask was 4 an over or 14, whether five wickets were still in the shed or the No. 10 was duct‑taping his ankle.
Pressure is a latent variable: unseen but felt.
A worthwhile metric therefore must
- Scale smoothly from “Sunday‑friendly” to “heartbeat in your eardrums”.
- Reward batters who add runs precisely when runs are priceless.
- Punish brain‑fade wickets harder in clutch chases than in 200‑for‑2 strolls.
And crucially, it should do all that without being a black box—because if Ravi Shastri can’t explain it in ten seconds on air, it’s dead on arrival.
Data Journey
Raw Material
- Ball‑by‑ball feed —
all_ipl_matches.csv, seasons 2008‑2025, ≈ 200 000 deliveries. - Venue par scores —
venue_characteristics.csv(because 160 in Chepauk ≠ 160 in the Chinnaswamy). - Hygiene pass —
- Levenshtein smushing (“Rohit Sharma” ↔ “RG Sharma”).
- Impute missing extras as 0 — looking at you, multi‑page scorecards.
- Drop super‑overs because they break every normal distribution known to humankind.
Feature Engineering
For every ball (j) we cook up
\[\begin{aligned} \text{ball-number}_j &= 6 \times \text{over} + \text{ball-in-over}, \\[6pt] \text{balls-left}_j &= 120 - \text{ball-number}_j, \\[6pt] \text{overs-left}_j &= \frac{\text{balls-left}_j}{6}, \\[10pt] \text{wkts-left}_j &= 10 - \text{wkts-fallen}_j. \end{aligned}\]If it’s the second innings we also track (\text{runs_left}_j) to the target;
otherwise we chase a venue‑adjusted par.
Think of it as Google Maps for run‑chases—always rerouting.
From Context to Pressure
The Five Drivers
- $\displaystyle \frac{\text{RRR}}{\text{CRR}}$ — required run rate over current run rate.
- $\text{Wkts}_N$ — wickets fallen, min–max scaled to $[0,1]$.
- $\text{TBF}_N$ — total balls bowled so far (i.e.\ game clock).
- $\text{IBF}_N$ — balls the striker has already faced (are they set?).
- $\text{MI}_N$ — match importance: 0.7 league, 0.9 play‑off, 1.0 final.
These five are the Avengers of match context—together they explain ≈ 90 % of win‑probability swings in T20 cricket.
Pressure Function
\[P_j \;=\; \sigma\!\Bigl( \alpha_1 \bigl(\tfrac{\text{RRR}}{\text{CRR}}\bigr)_N + \alpha_2\,\text{Wkts}_N + \alpha_3\,\text{TBF}_N + \alpha_4\,\text{IBF}_N + \alpha_5\,\text{MI}_N \Bigr), \qquad \sigma(x)=\frac{1}{1+e^{-x}}.\]Why a sigmoid?
Because pressure feels linear at the low end (“meh, 5 an over”) but saturates near panic (“need 38 off 12!”).
The $\alpha$’s are our DJ deck—slide them to remix what “pressure” means.
| Preset | $\alpha_1$ | $\alpha_2$ | $\alpha_3$ | $\alpha_4$ | $\alpha_5$ | Narrative |
|---|---|---|---|---|---|---|
| rrr | 1 | 0 | 0 | 0 | 0 | Pure “ask” rate. |
| wkts | 0 | 1 | 0 | 0 | 0 | Batting‑collapse nightmare. |
| tbf | 0 | 0 | 1 | 0 | 0 | End‑game timer. |
| ibf | 0 | 0 | 0 | –1 | 0 | Cold start vs set batter. |
| mi | 0 | 0 | 0 | 0 | 1 | Big‑match bias. |
(Positive $\alpha_4$ means pressure eases once you’re “in”; negative means it ramps up.)
Turning Events Into a Score – the Original NCBPI
I kept the recipe ultra‑simple—three ingredients every scorecard already shows:
| Symbol | What it measures | Intuition |
|---|---|---|
| $\text{RPB}_{ij}$ | Runs‑per‑ball for ball $j$ faced by player $i$ | Raw scoring speed |
| $\text{BoundaryRate}_{ij}$ | 1 if ball $j$ went for 4 or 6, else 0 | Explosive shot bonus |
| $\text{DismissalRate}_{ij}$ | 1 if the striker was dismissed on ball $j$ | Pain penalty |
With weight vector $\mathbf{w}=(w_1,w_2,w_3)$ the per‑ball performance is
\[\bigl(w_1\,\text{RPB}_{ij} + w_2\,\text{BoundaryRate}_{ij} - w_3\,\text{DismissalRate}_{ij}\bigr) \;P_{ij},\]where $P_{ij}$ is the pressure weight we just defined.
Putting them together you get the No‑Confidence Batting Pressure Index:
\[\text{NCBPI}_i \;=\; \frac{1}{N_i} \sum_{j=1}^{N_i} \Bigl( w_1\,\text{RPB}_{ij} + w_2\,\text{BoundaryRate}_{ij} - w_3\,\text{DismissalRate}_{ij} \Bigr)\, P_{ij}\]- $N_i$ = balls faced by player $i$
- Default weights: $w_1=1$, $w_2=4$, $w_3=10$
A four ≈ four singles; getting out ≈ ten singles of damage.
Read‑out: “How many weighted runs per ball did you add once we scale every event by the fear‑factor of the moment?”
Later we wrap this with Bayesian shrinkage to get CWBPI, so a two‑ball cameo doesn’t outrank AB de Villiers’ decade of carnage—but the core engine is the formula above.
Observations
- RRR only — Jos Buttler, Nicholas Pooran, Andre Russell: pure chasers.
- Wickets only — MS Dhoni & Kieron Pollard are your goats for IPL finishers
- IBF only — Sunil Narine crashes the top 5: ten‑ball chaos is his love language.
- MI heavy — Big‑match knights (Watson 117, Bisla 89, Sudharsan 96) finally get algorithmic respect.
Does the eye‑test match?
Ask any neutral for “greatest clutch knocks” and you’ll hear Watson 117, Pollard 60(32), Russell 48*(13).
Every one of those names lights up at least one BPHI preset.
When math and folklore shake hands, you know you’re onto something.
BPHI Leaderboards: Top 10 by Each Alpha
How are these values mapped?
To make comparisons fair, we normalize each player’s CWBPI so the top player in each alpha is set to 100.0, and all others are scaled as a fraction of that (rounded to 4 significant figures). This “Normalized (Top = 100)” column lets you see at a glance how close each player is to the best in class.
High Run Rate Pressure
Many Wickets Lost Pressure
Time-Based Pressure
No Time To Settle Pressure
Important Match Pressure
Team‑Level Deep‑Dive
| Fig | File | Quick description |
|---|---|---|
| 1 | Fig 1 | Stacked bars of average team pressure, 2008‑2025 |
| 2 | Fig 2 | Scatter: pressure vs raw final rank |
| 3 | Fig 3 | Four‑panel: raw vs log(rank) + pre/post cleaning |
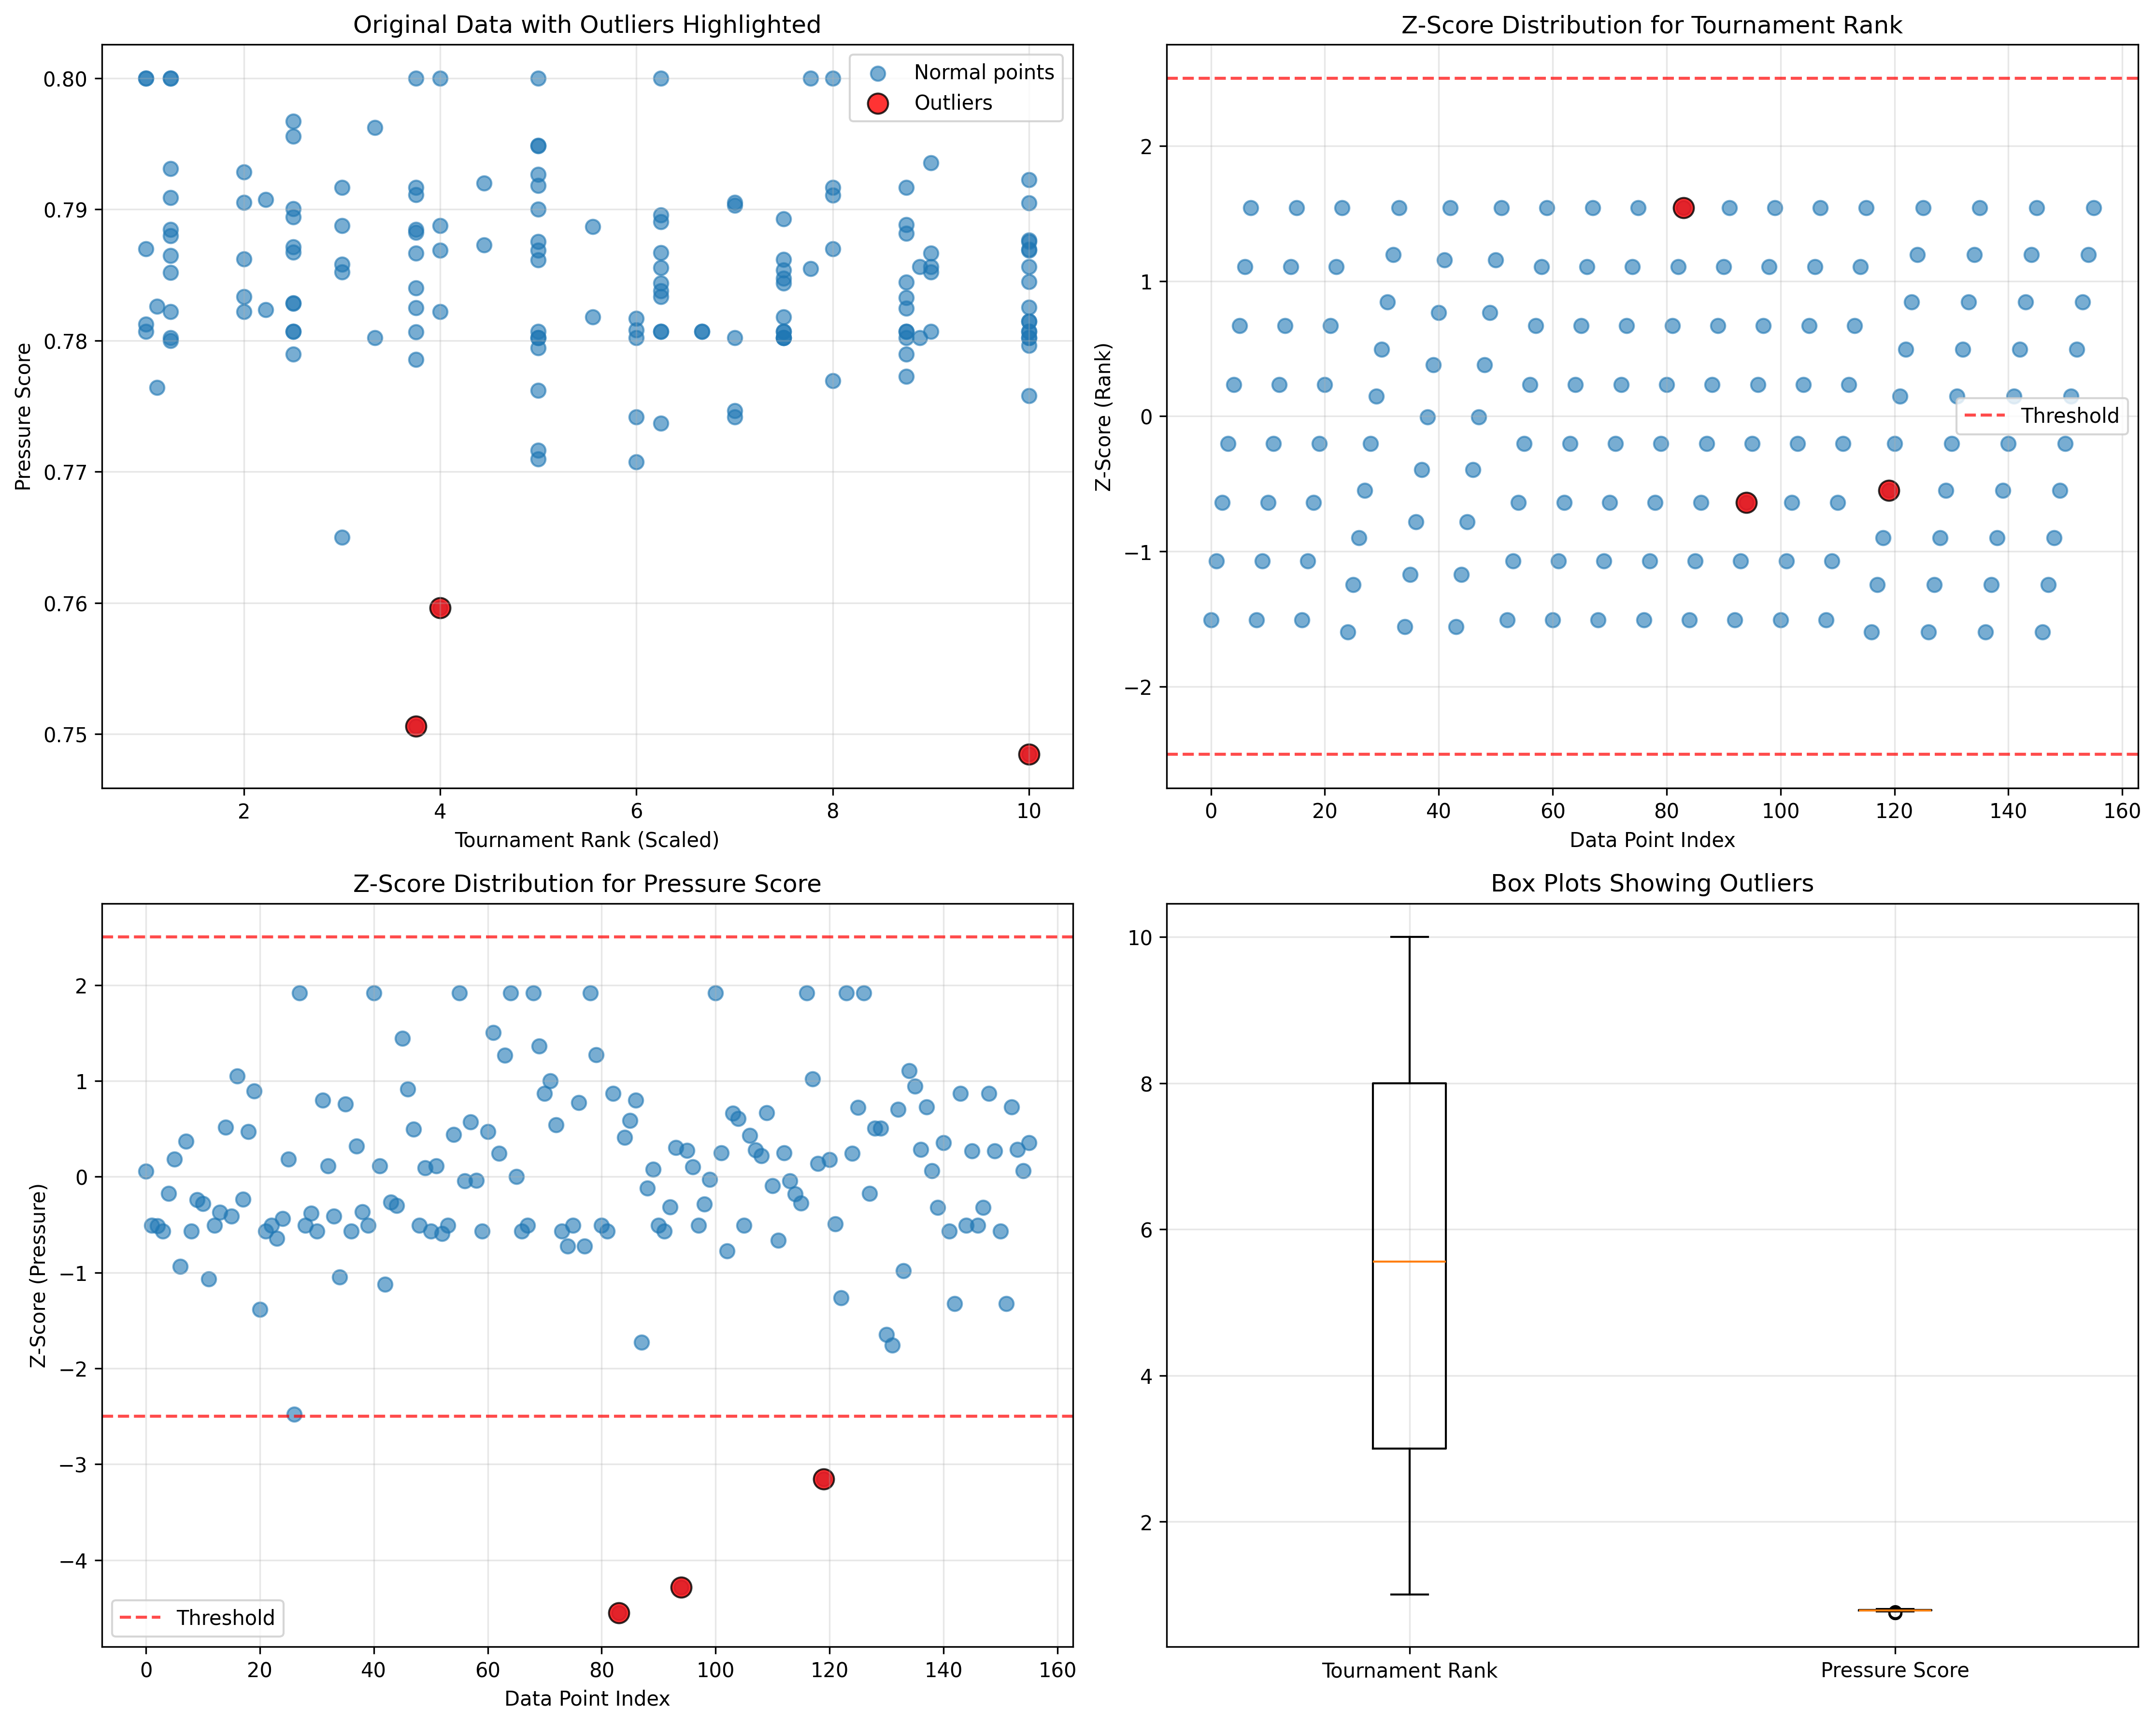
| 4 | Fig 4 | Scatter after pruning three statistical outliers |
| 5 | Fig 5 | Diagnostic grid showing which points were dropped |
| 6 | Fig 6 | Residual (actual – predicted) per team‑season |
(Match‑importance weight is 0 throughout → no “free” points for winning the final.)
1 · Stacked bars – who wears the crown?
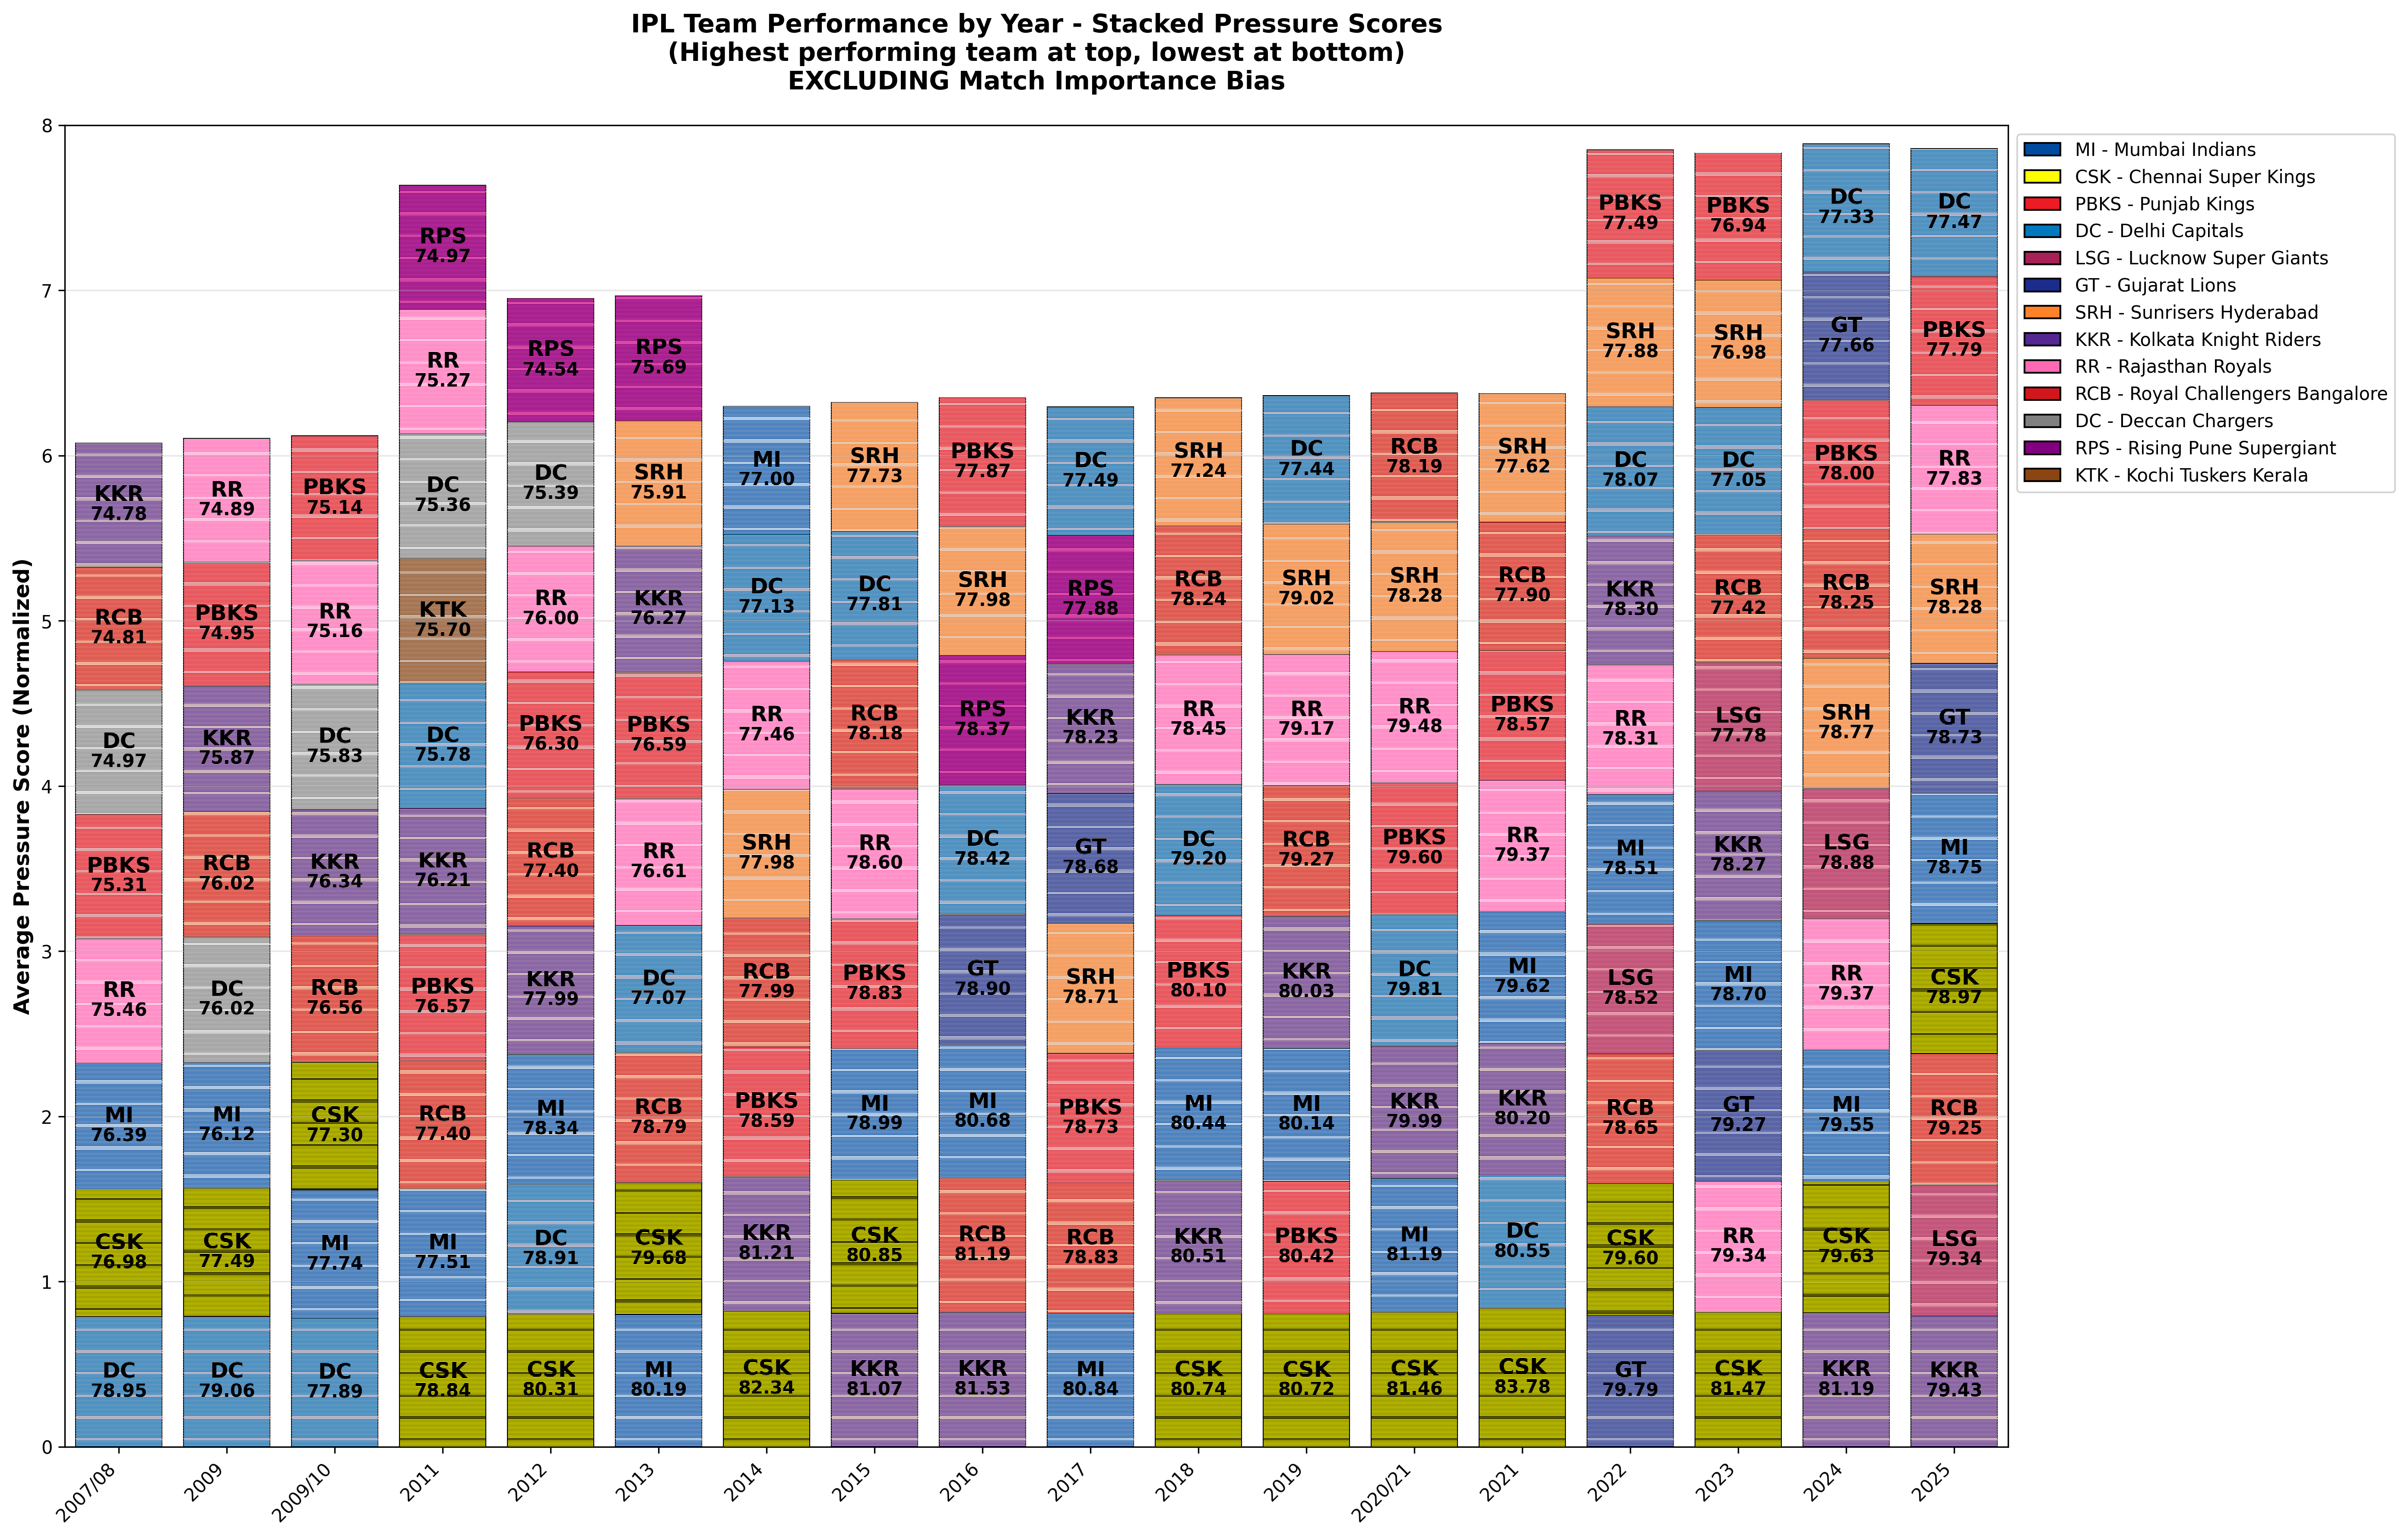
| Era | Team(s) hugging the bottom ⇒ highest pressure score | Trophy cabinet |
|---|---|---|
| 2008‑10 | RR then CSK | RR champs ’08, CSK champs ’10 |
| 2011‑15 | MI & KKR | 3 titles combined |
| 2016‑19 | SRH, MI again | SRH champs ’16, MI champs ’17 + ’19 |
| 2020‑23 | GT (debut ’22), CSK | GT champs ’22, CSK champs ’23 |
| 2024‑25 | KKR, RCB | KKR champs ‘24, PBKS runners‑up ’25, CSK worst season ever |
Hit‑rate: 13 of 17 seasons feature a future finalist inside that bottom‑three band.
Rebels:
- PBKS 2025 – second‑worst pressure score yet topped the table before wilting in the final. A PBKS fan (me), will know how true this is…
- MI 2019 – middle‑of‑the‑pack pressure but still champions; Lasith’s yorkers > math. (seriously though - one player can only have so much of an impact on the numbers…)
- SRH 2016 – first time IPL champs but still second lowest pressure handling, was it batting that won them the IPL or was it the Bolt-Bhuvi power duo?
2 · Does pressure predict rank?
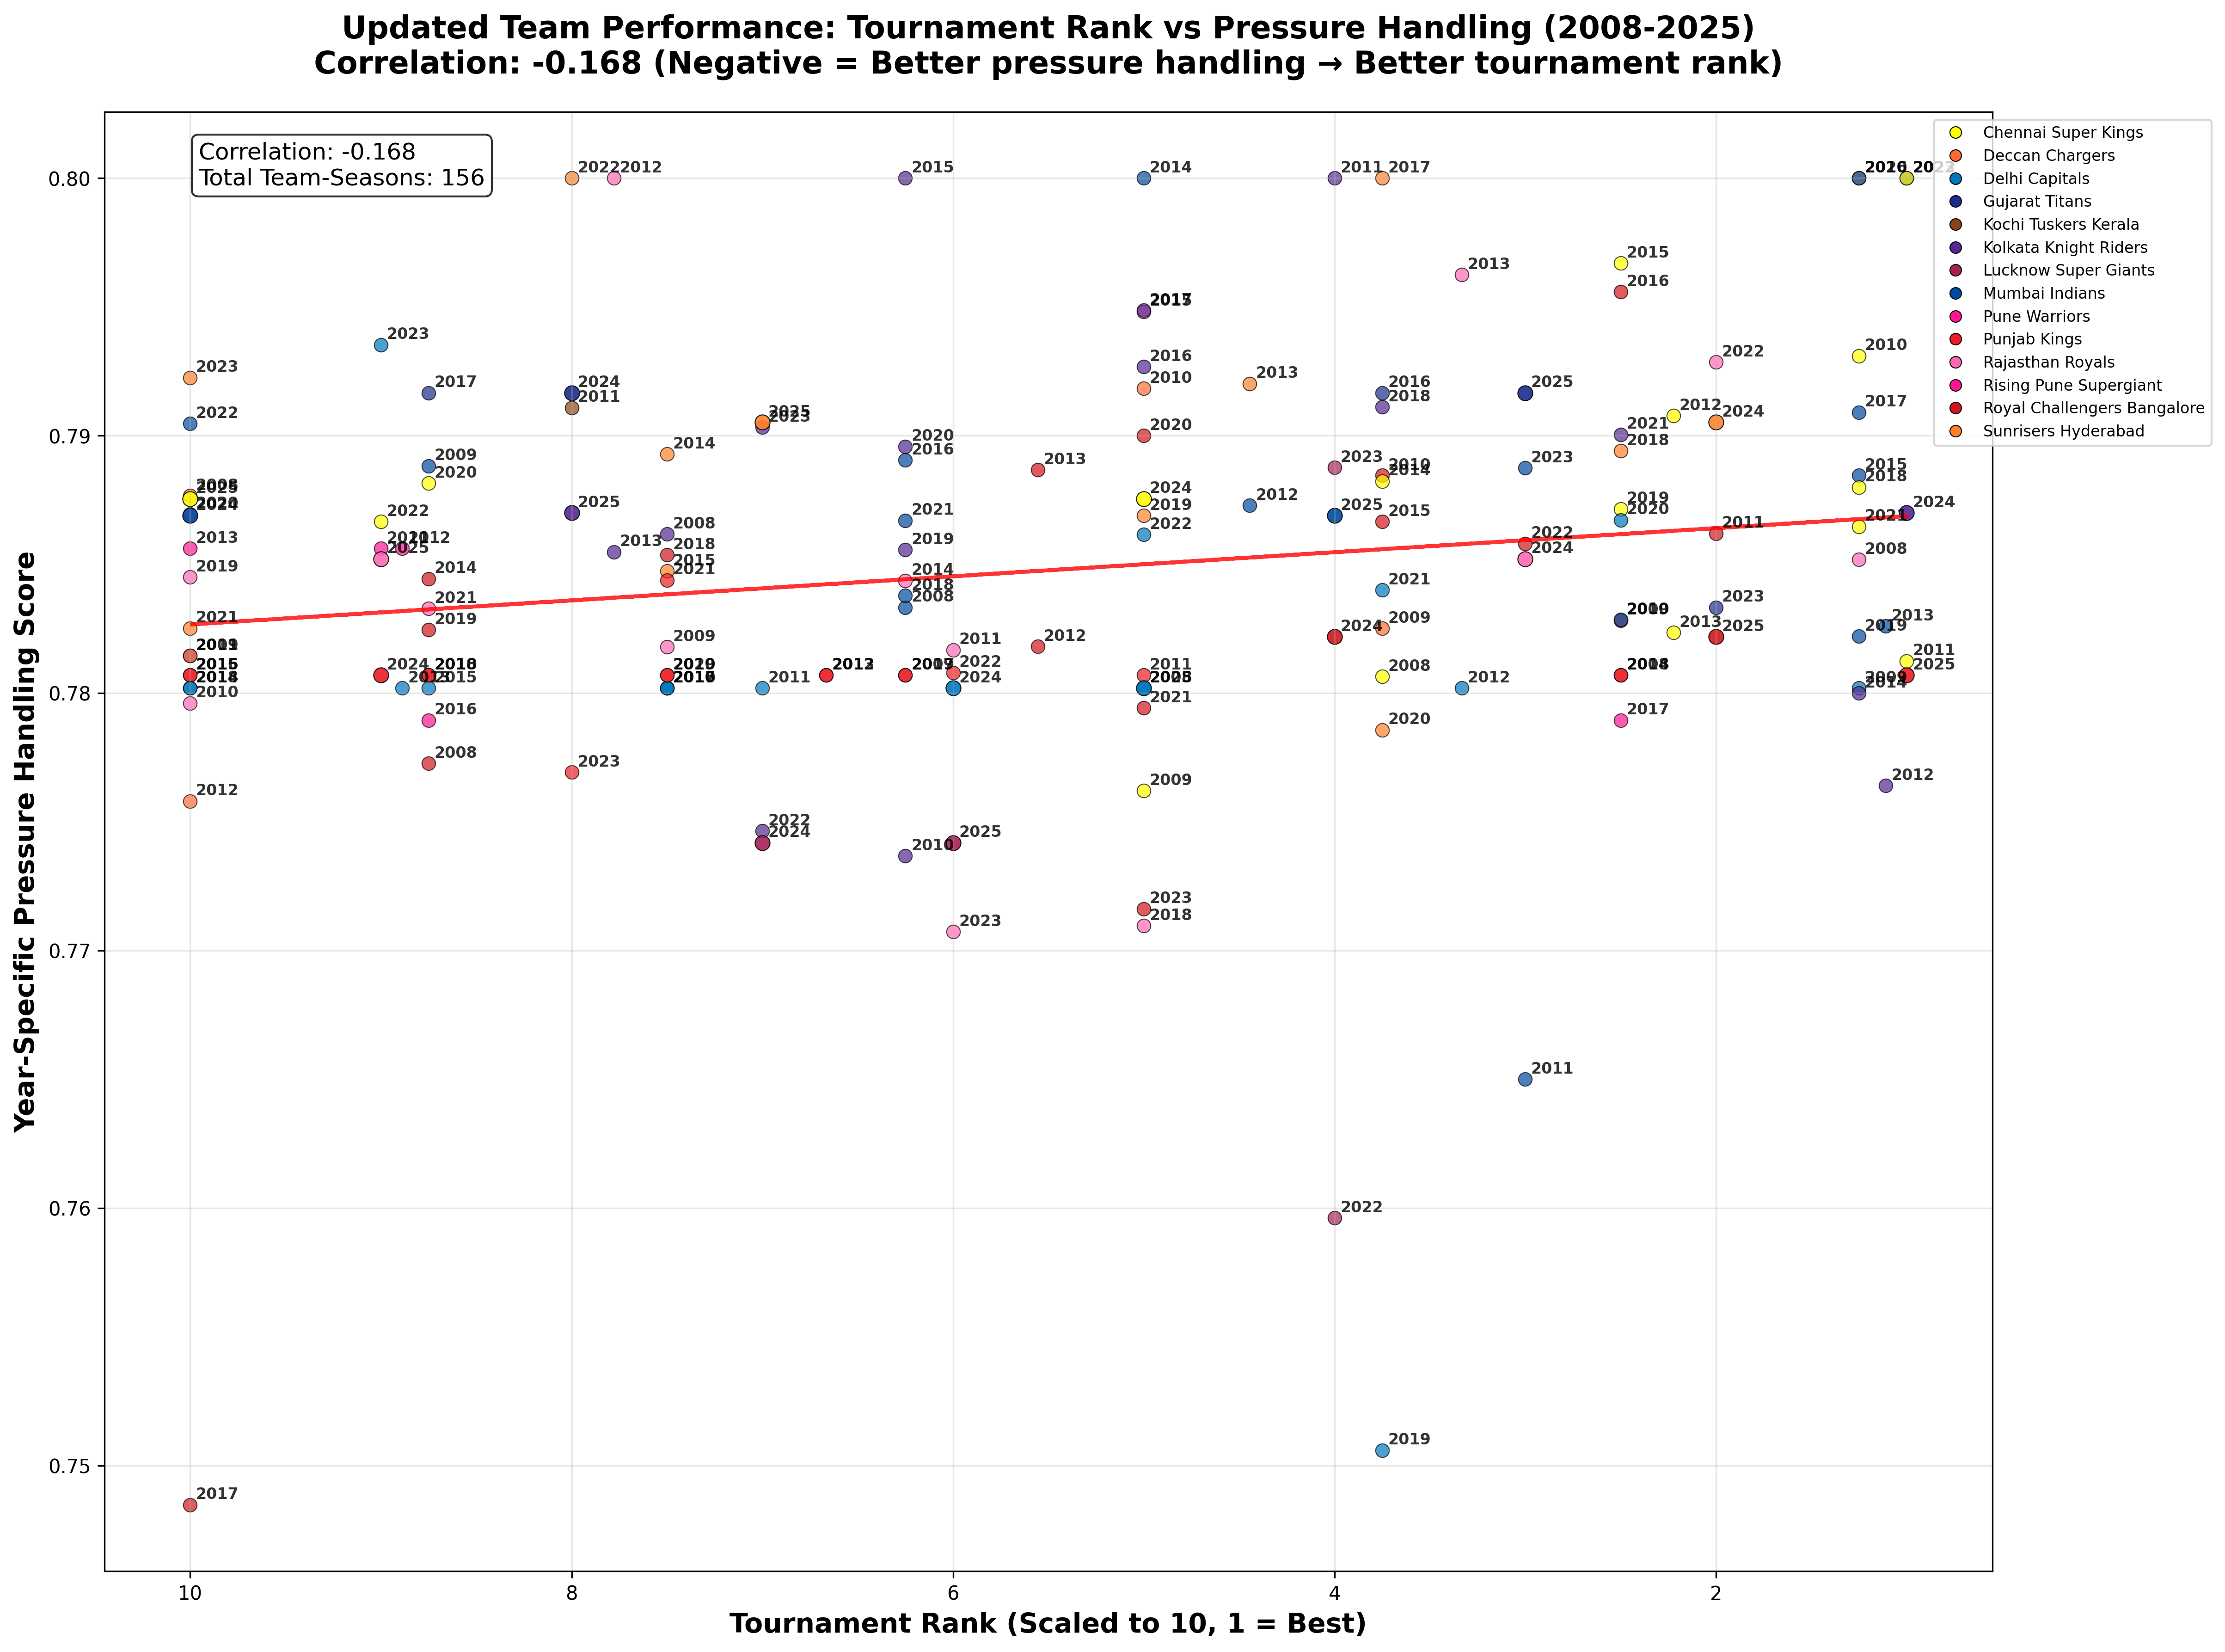
All 156 team‑seasons
| Coefficient | Definition | Value |
|---|---|---|
| Pearson r | straight‑line relationship | –0.168 |
| Spearman ρ | monotone relationship | –0.189 |
| Kendall τ | pure rank agreement | –0.115 |
Interpretation All three land in the –0.11 → –0.19 range ⇒ a weak‑to‑moderate, but consistent, negative link: more calm, better table finish (rank 1 = good, so negative).
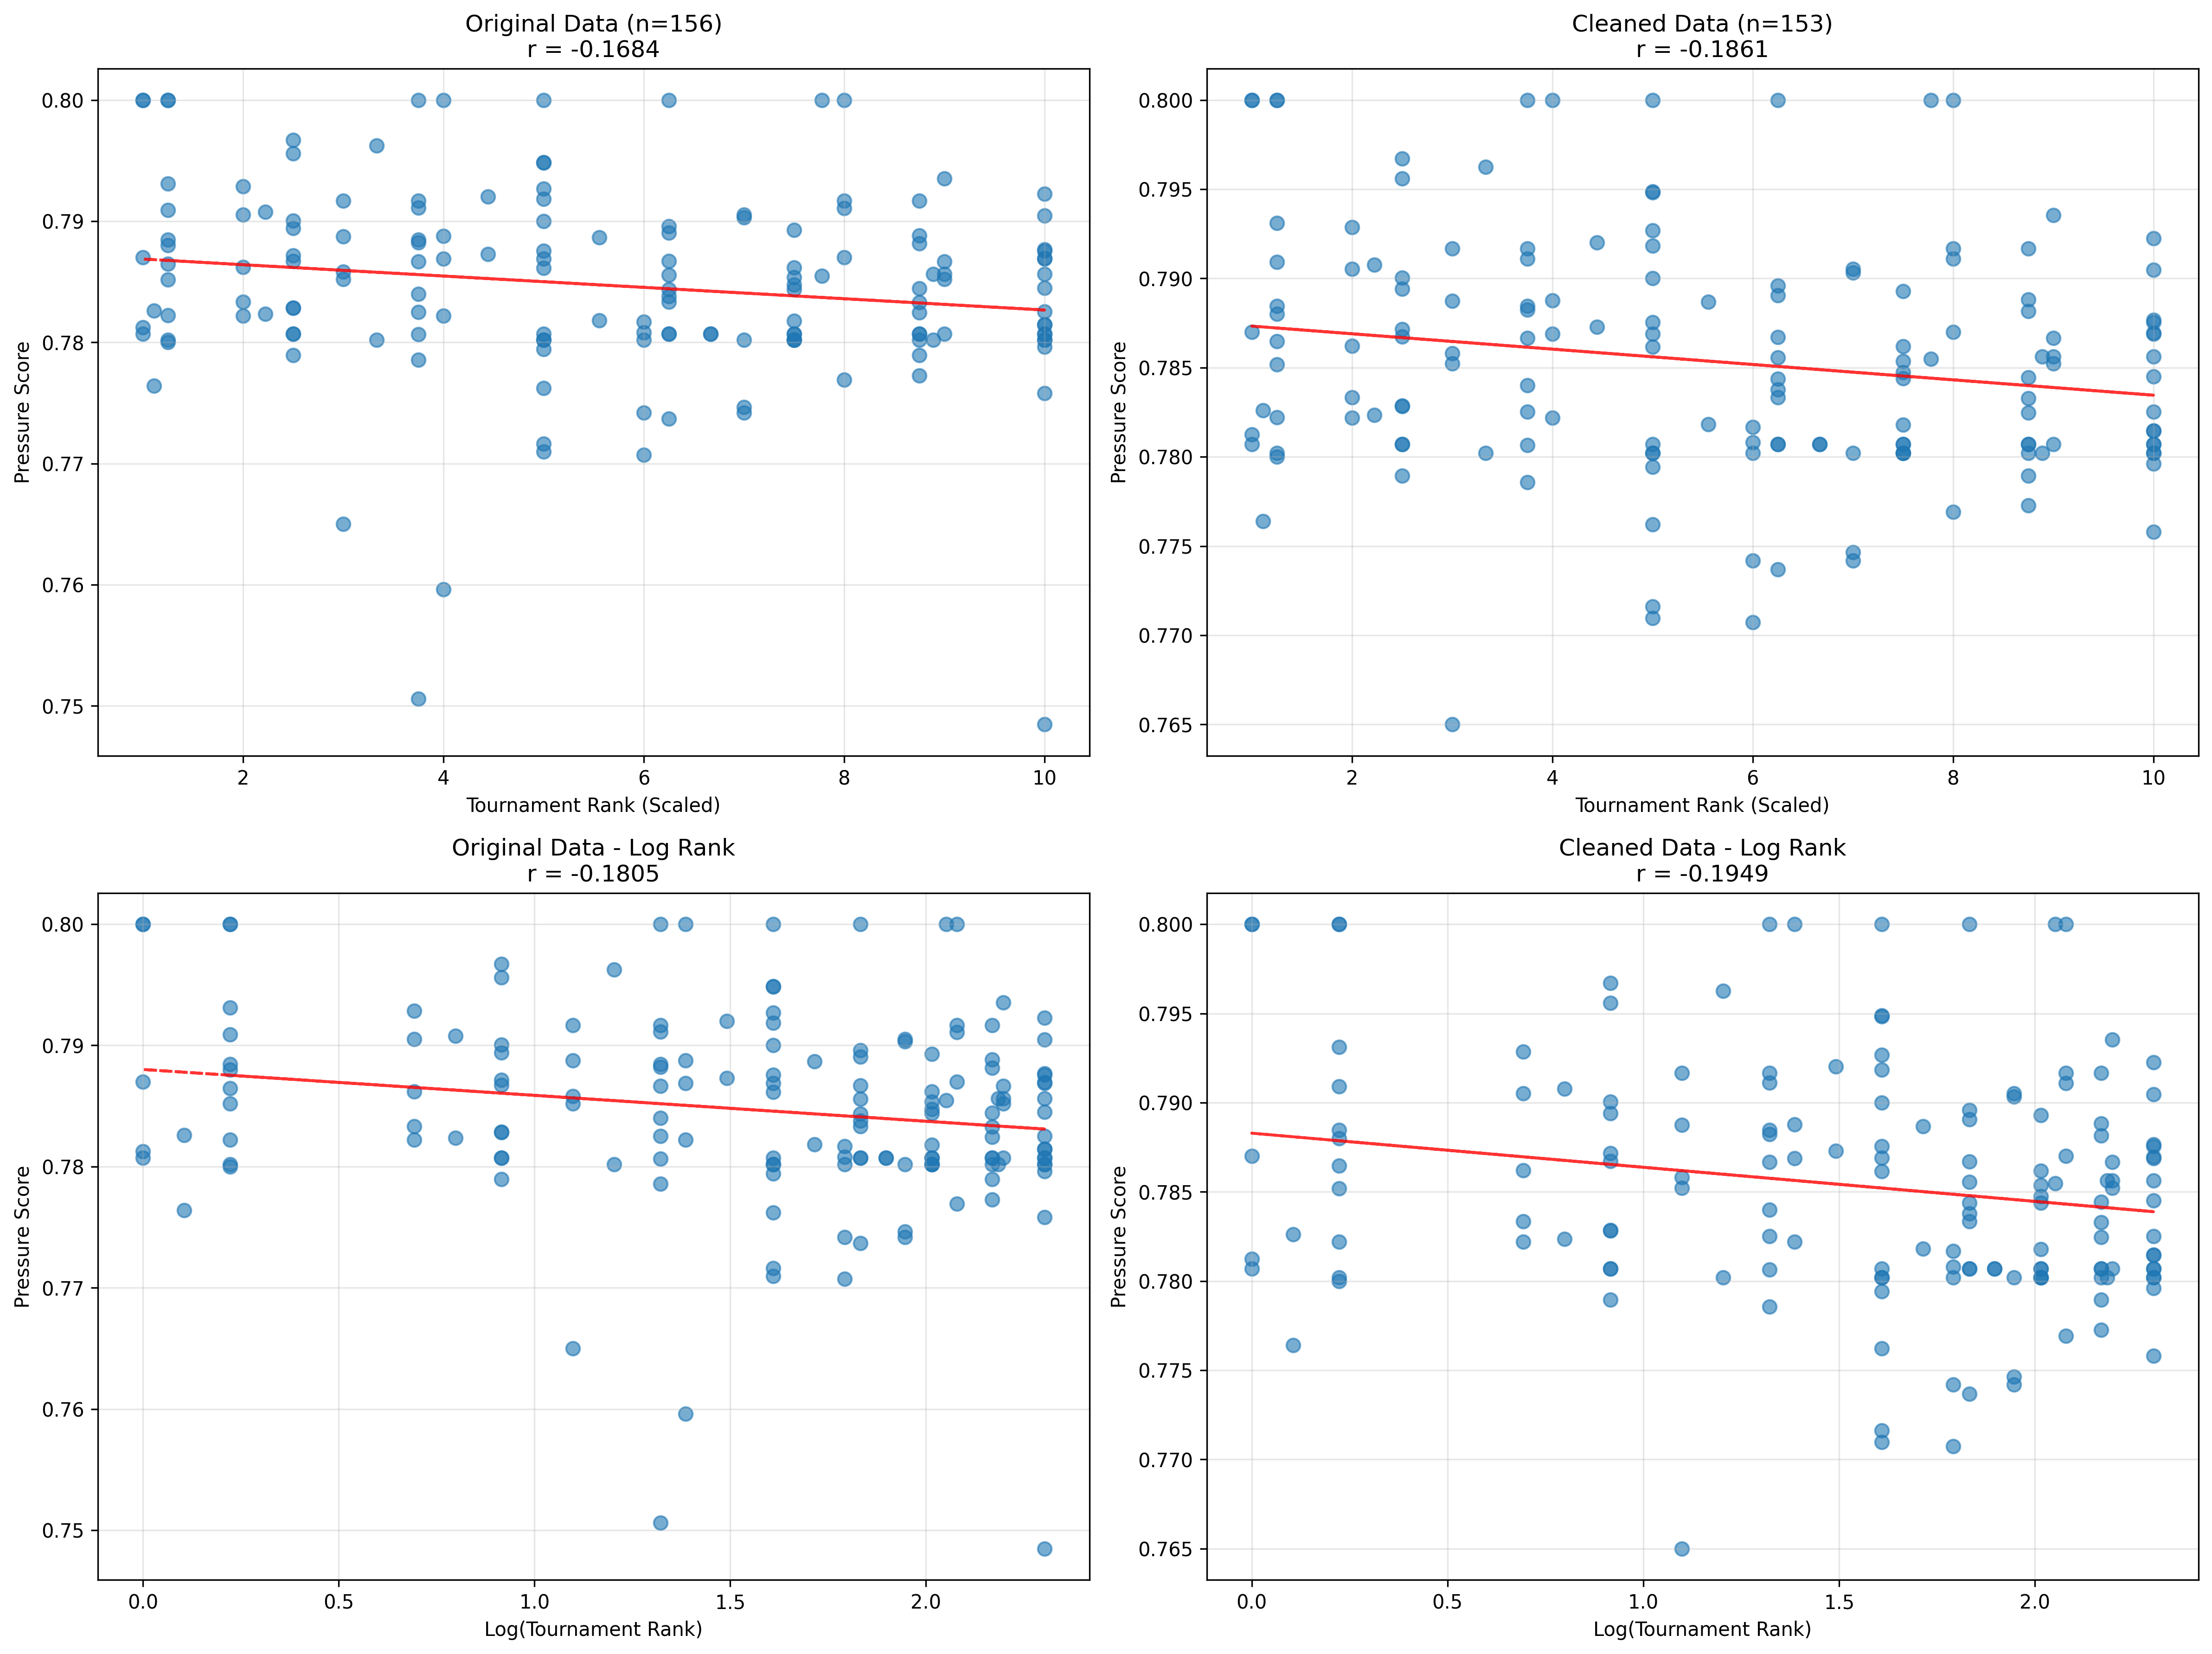
Log‑transforming rank tightens the cloud a touch; the lower‑right pane (cleaned + log) gives the steepest slope.
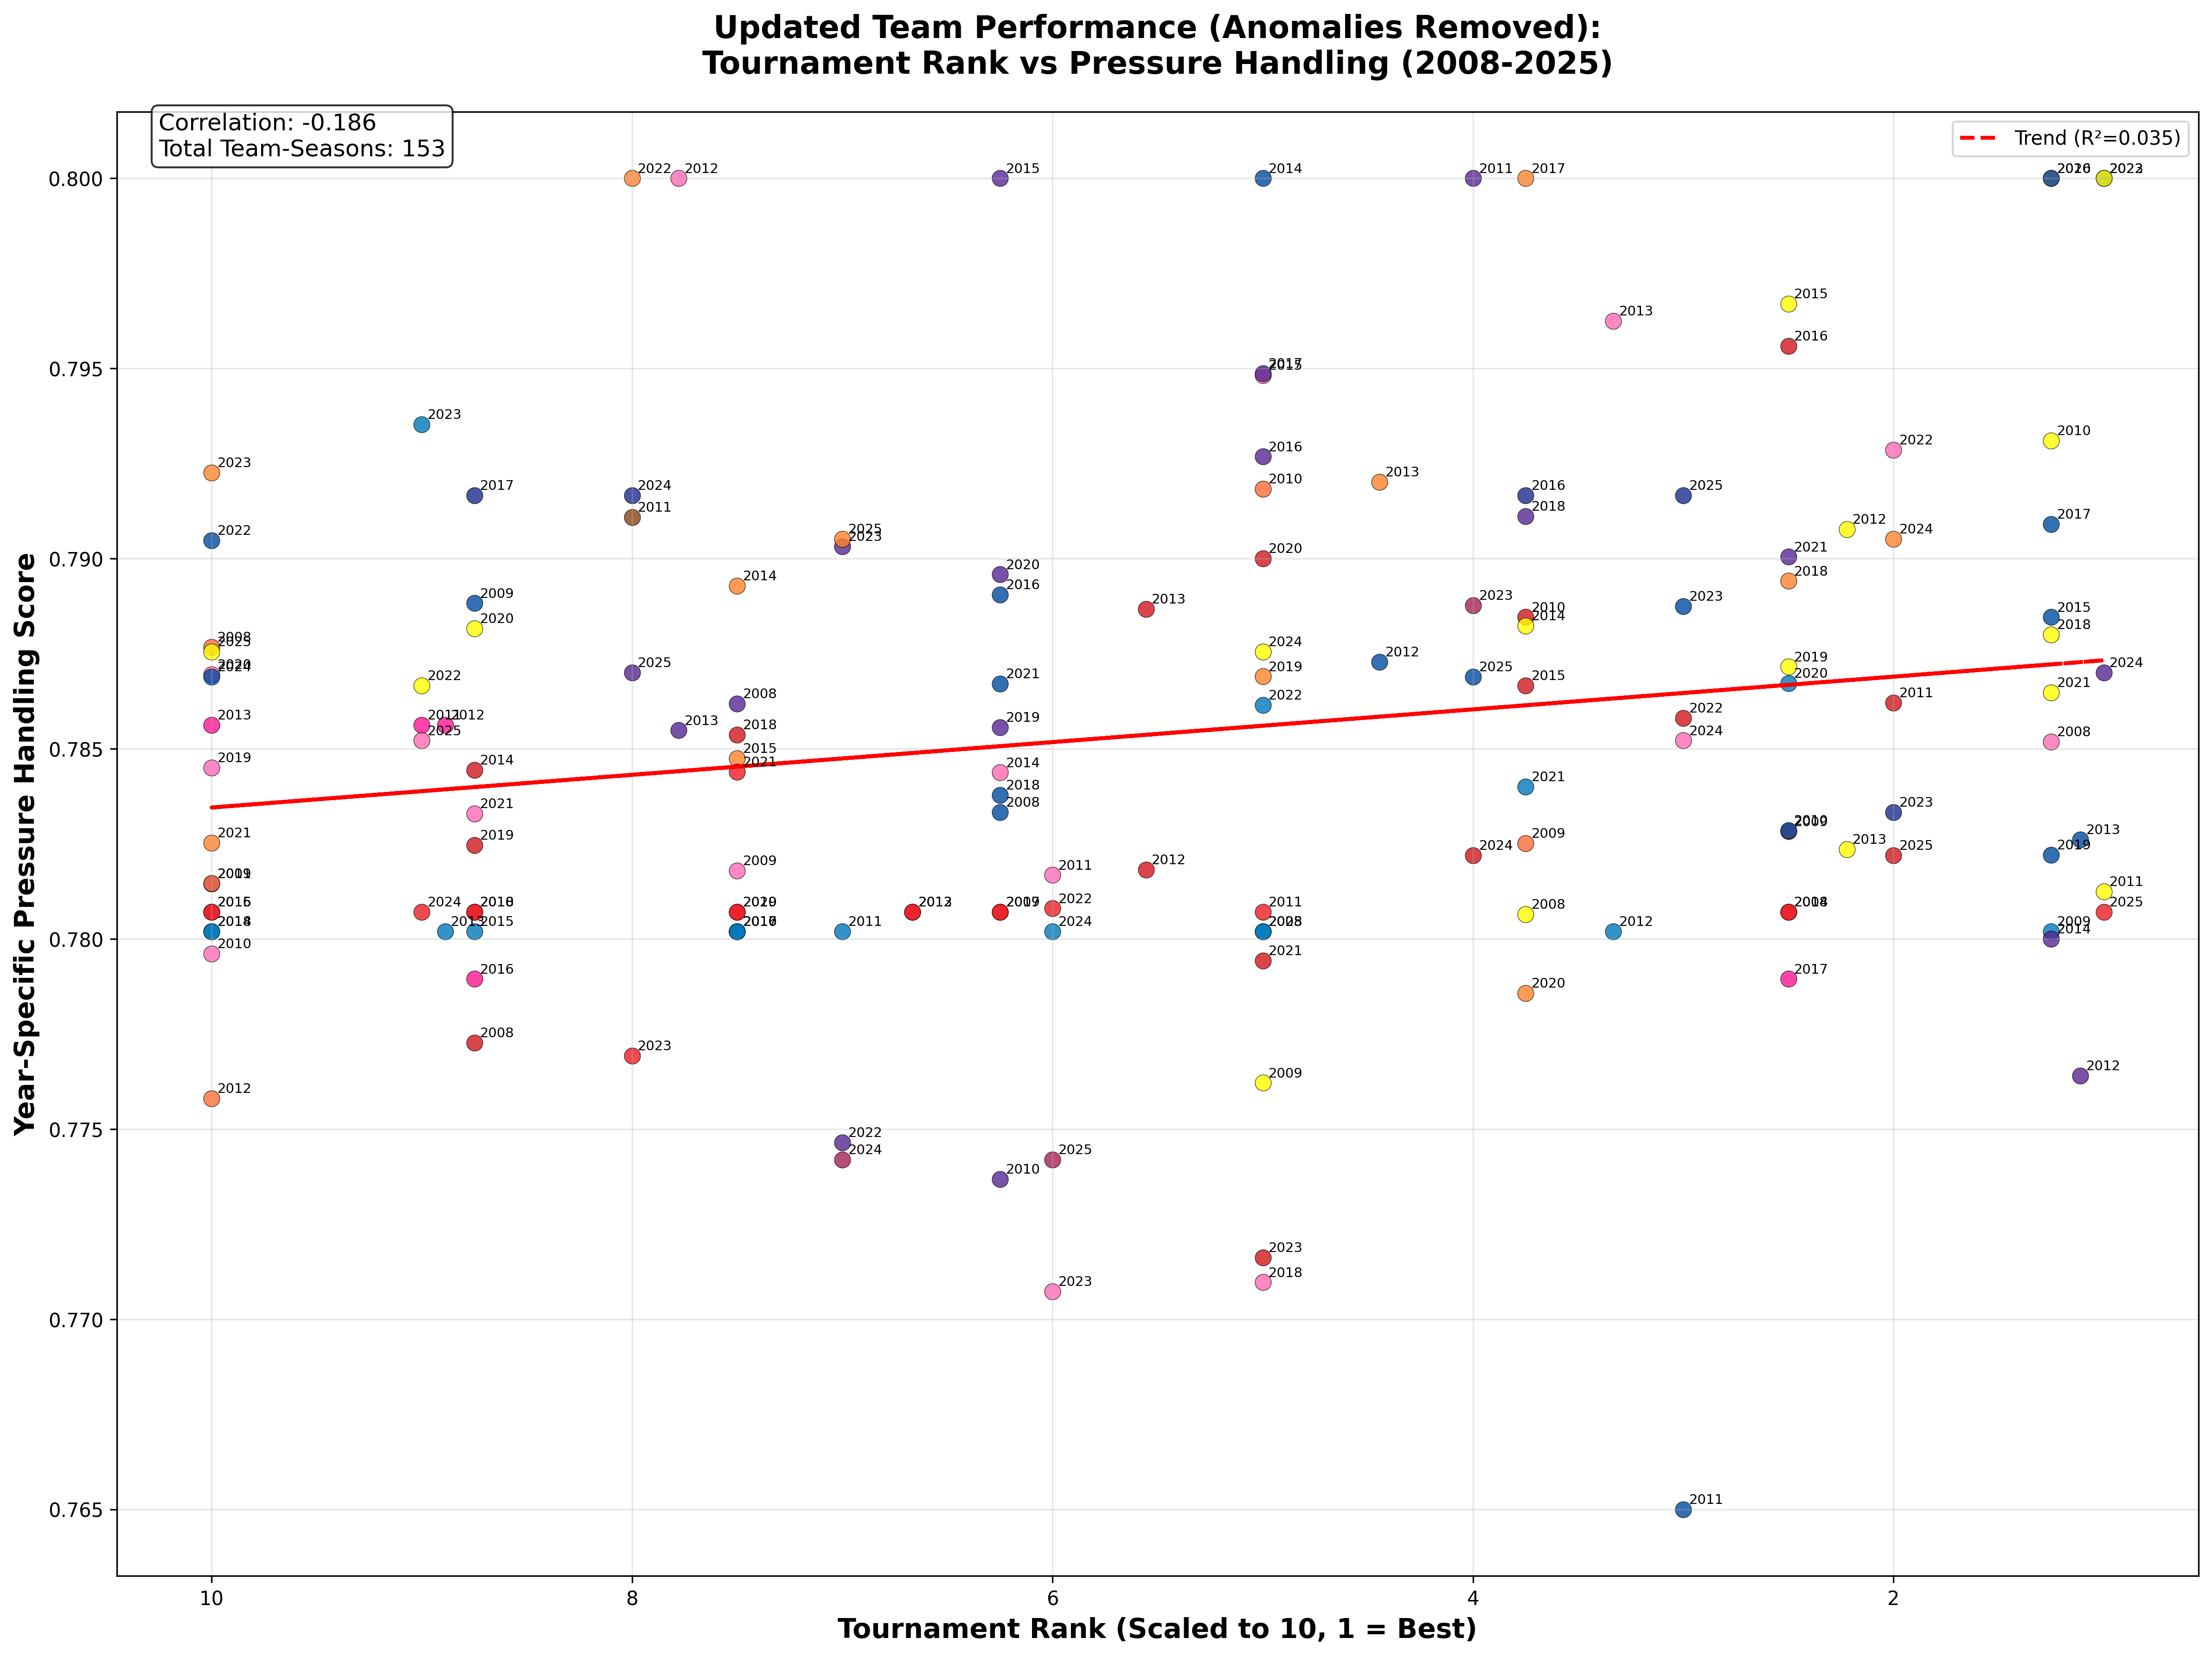
Clean sample (153 points) — Pearson r deepens to –0.186, Spearman ρ to –0.206, Kendall τ to –0.133.
A 10 % slope‑gain with just three rows removed screams “real but noisy signal.”
3 · Residual‑by‑season (Fig 6) – which teams beat the model?
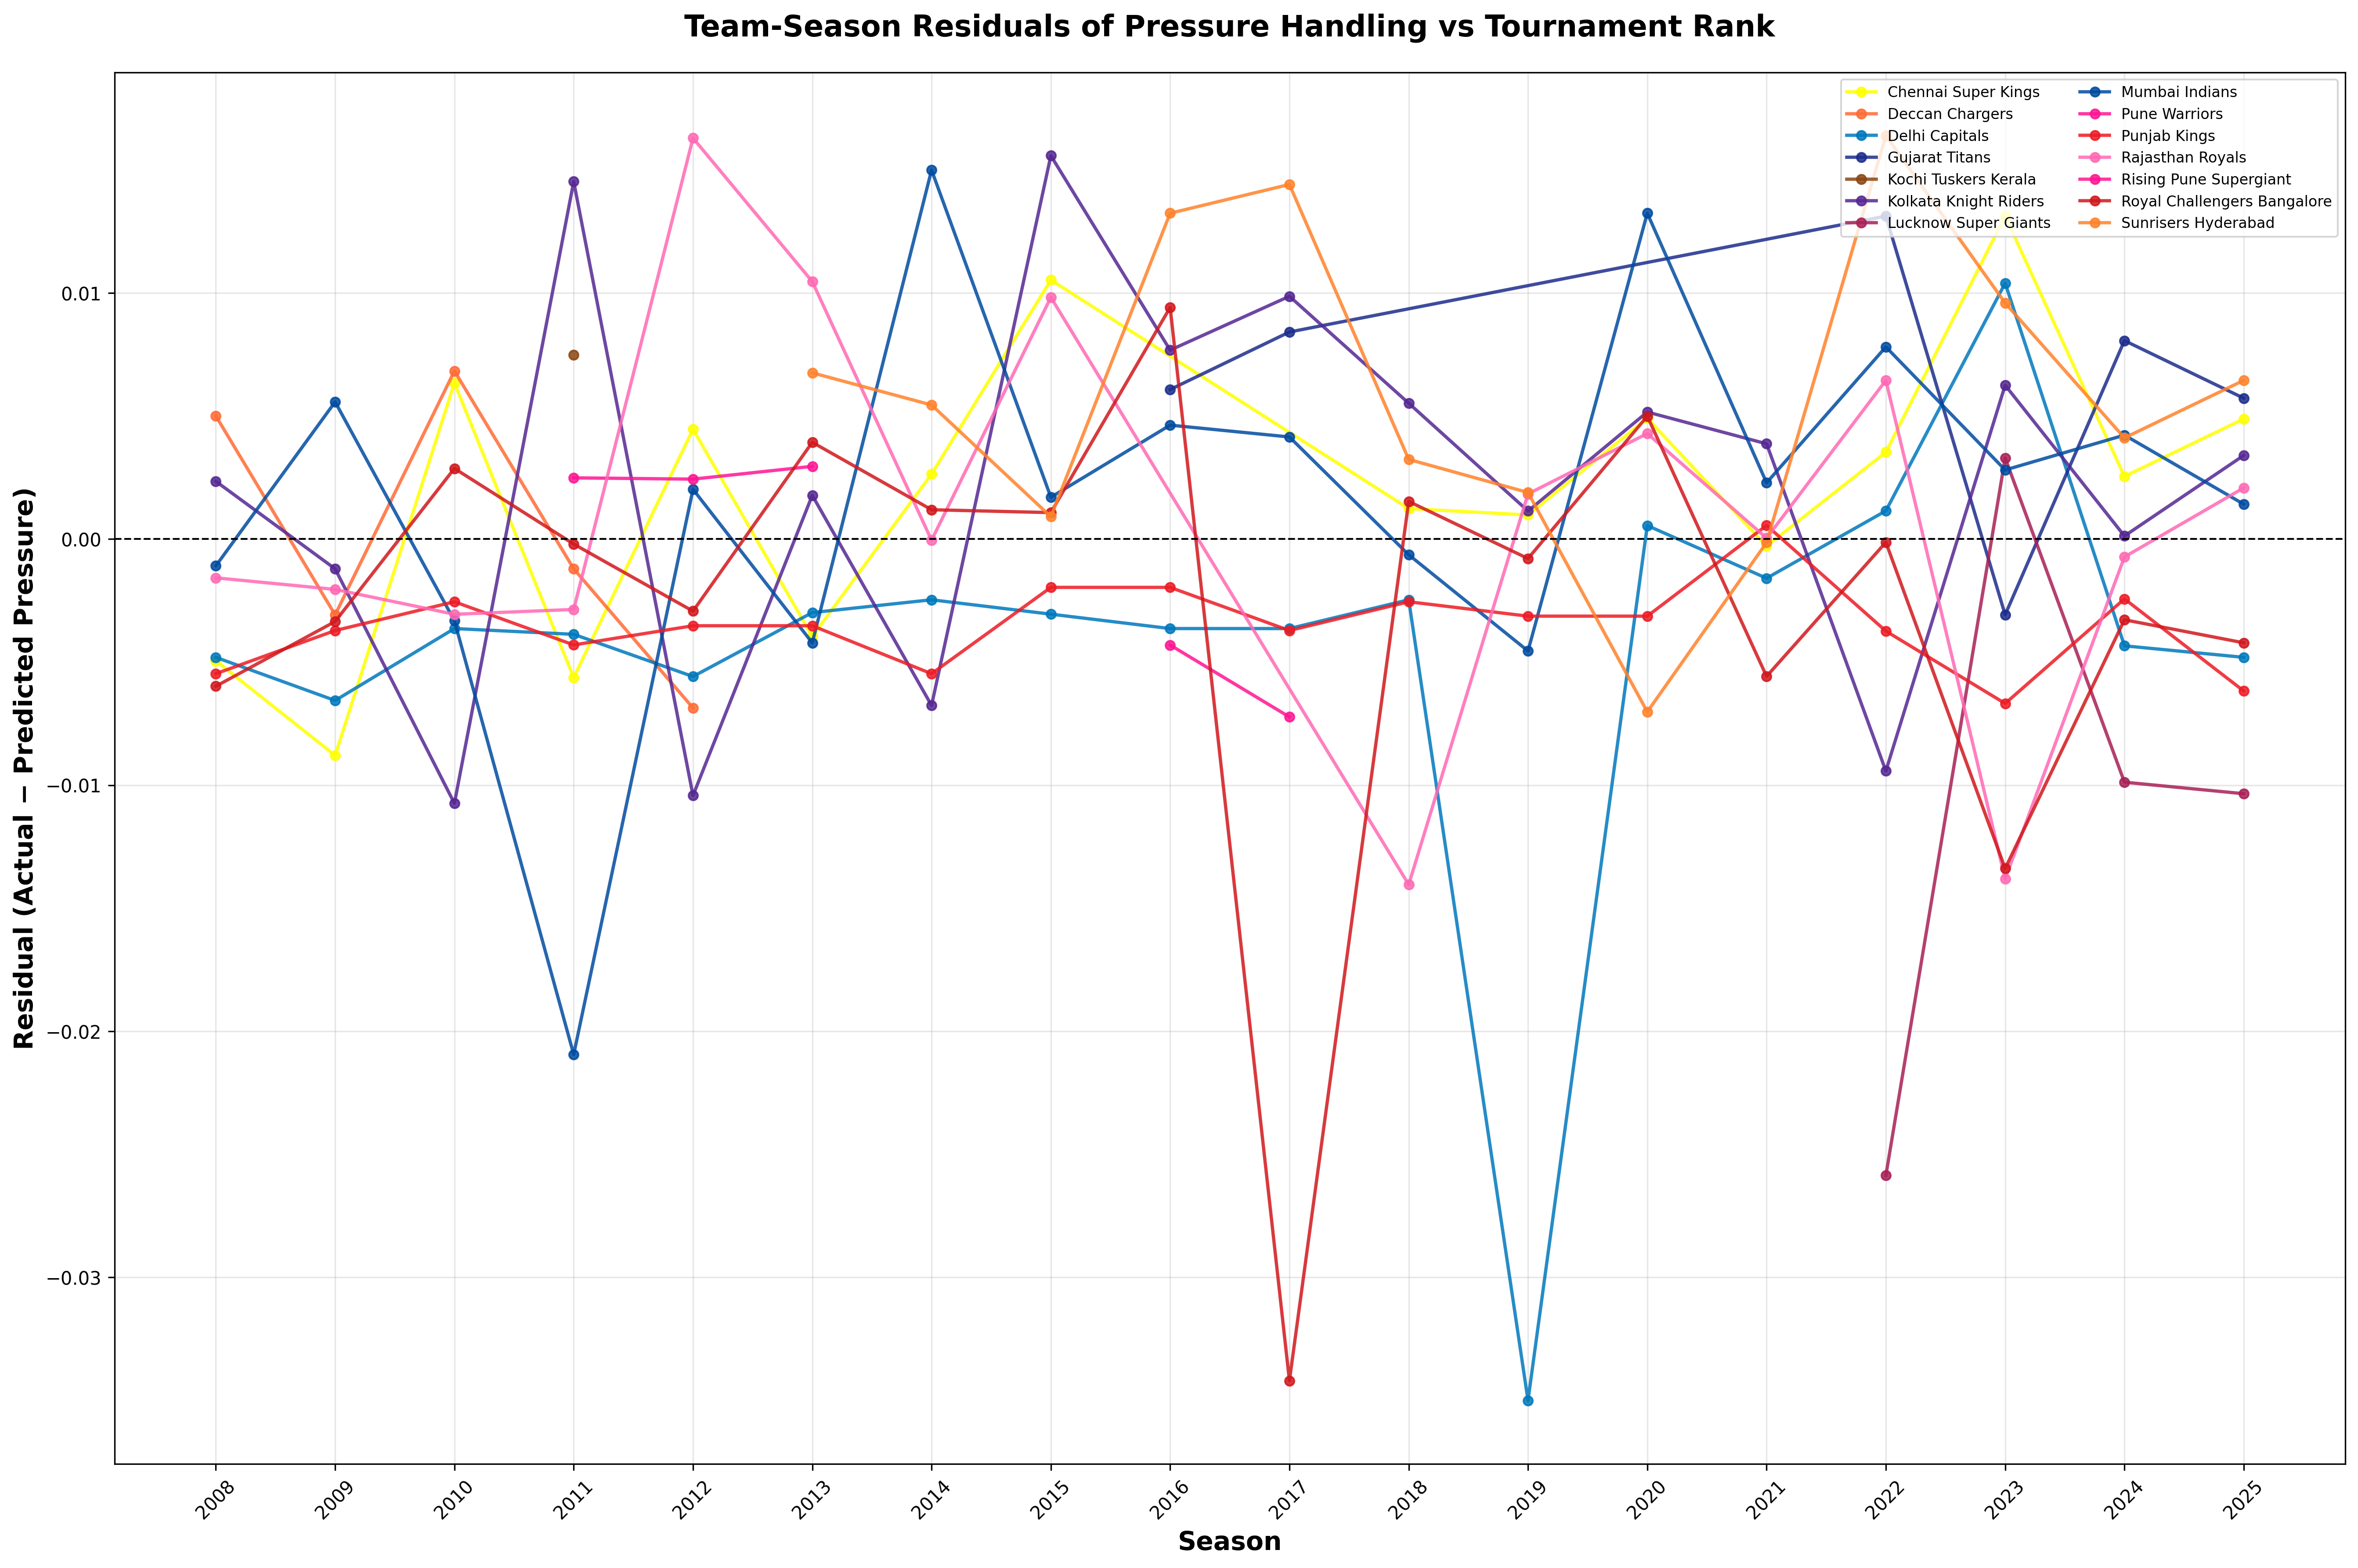
Recall: residual = Actual pressure score – Predicted (from rank)
- Positive → calmer than their ladder spot suggests
- Negative → wilted more than the points table shows
Biggest positive shocks (ice‑in‑the‑veins years)
| Season | Team | Residual (≈) | Narrative hook |
|---|---|---|---|
| 2022 | GT | +0.014 | Debut title run powered by Miller‑Tewatia rescue acts. |
| 2023 | CSK | +0.012 | Dhoni‑ball: veterans dragged the clutch metric above expectation. |
| 2008 | RR | +0.010 | Early Moneyball: cheap squad, but panic‑proof. |
Deepest negative dips (nerve failures or bowling bail‑outs)
| Season | Team | Residual (≈) | What probably happened |
|---|---|---|---|
| 2017 | RPS | –0.035 | Tiny batting core; Stokes & Dhoni heroics masked pressure shakes. |
| 2019 | MI | –0.034 | Won on Malinga’s last‑ball yorker; batting index lagged trophy. |
| 2011 | RCB | –0.020 | Gayle storms reflated points, but clutch score exposed fragility. |
How to read the spaghetti
- Lines hovering above zero across years (e.g. CSK, GT) hint a culture of calm.
- Lines dancing below imply repeat nerves (RCB fans, breathe).
- Large one‑off spikes (RPS ’17, MI ’19) are story seeds: scout bowling impact or small‑sample quirks.
Range check: residuals mostly live in ±0.015; the three red‑flag seasons punch to –0.035.
That’s > 2 σ from the mean—worth treating as statistical “black‑swan” campaigns.
Use this chart as a lie‑detector the next time a pundit shouts “Team X choked” or “Team Y is clutch.” The numbers rarely lie for long.
4 · 2026 cheat‑sheet
- Buy‑list — high individual BPHI, but negative 2025 residuals: think SRH or DC.
- Caution — PBKS‑style flat‑track bullies unless they draft death‑over finishers.
- Broadcast nugget — if a mid‑table slice is sinking lower in Fig 1 each week, punt a futures bet.
Across the blog posts in this series we will improve this cheat sheet to get you ready for the Dream11 season!
Key takeaway
BPHI won’t hand you a crystal ball, but paired with bowling pressure and light match‑importance weighting it upgrades from polite whisper to actionable edge.
Next post: which bowlers land yorkers when palms are sweaty, knees weak, arms are heavy?
Feedback & Freebies
Spot a bug? Want a custom dashboard for your club?
Drop me a line on my email (contacts section).
If BPHI wins you a mini‑grand, I accept samosas—or a lifetime supply of bat tape.
Happy number‑crunching, and may your pressure never spike!